
Luxury Real Estate Report: Nov 2023 – The Fall Season
Luxury Real Estate Report: Nov 2023 – The Fall Season
A dated guide to the November 2023 RE Luxe Leaders report, its map, and the method used to compare area-level luxury markets.
The November 2023 report describes a varied U.S. luxury real estate landscape using information available around October 30, 2023. Its purpose is to compare market conditions at the area level, where a regional pattern can look very different from an individual property. Read the map with its date and definitions in view; it is a historical snapshot rather than a current forecast.
Here are some specific highlights:
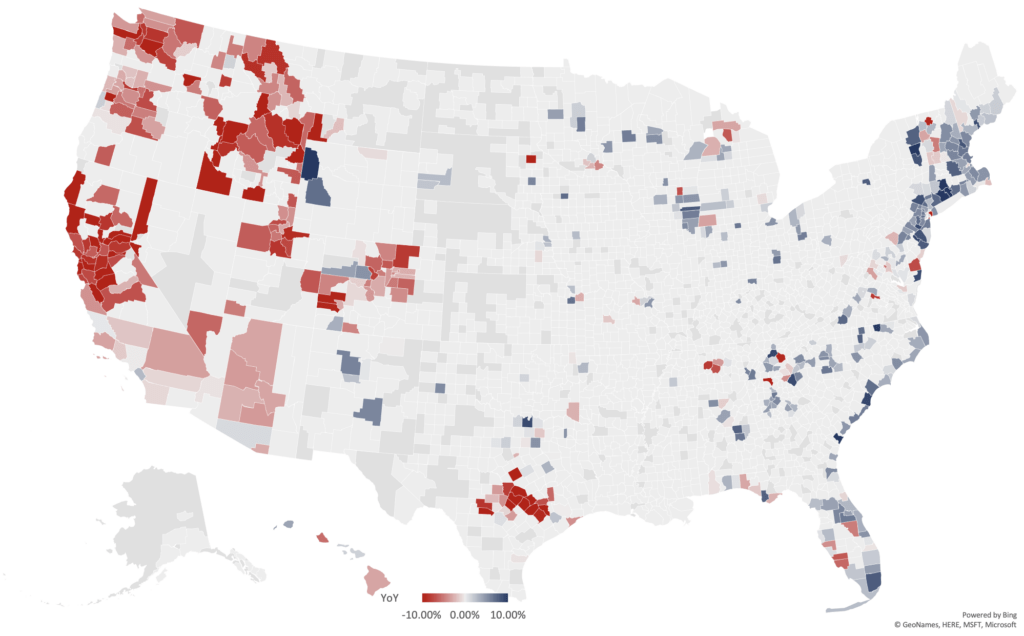
The map shows positive and negative year-over-year movement distributed across the country, with concentrations of color in coastal, mountain, and metropolitan areas. A shaded county or area is a signal to investigate the local inventory, sales mix, and timing behind it. It does not by itself explain a buyer’s decision or establish the value of a particular home.
Regional variation is the central practical takeaway. Established high-value areas and emerging luxury markets can move differently, while thin transaction counts can make a local average sensitive to the properties that closed in the period. Use the report to frame questions for a current local review and state clearly when the underlying observation is historical.
Year over Year National Luxury Real Estate Report Map
The report’s map uses a red-to-blue year-over-year scale centered on zero. Red and blue indicate the direction and relative intensity shown by the legend; pale areas are closer to the center of the scale. Preserve the legend, date, and provider credits when presenting the map, and do not read its colors as a guarantee of future appreciation or decline.
Here are the recent 2023 Luxury Real Estate Report numbers for the data geeks:
For a number to be useful, identify its observation date, geography, property universe, and calculation. Average values can be influenced by the mix of homes that sold, while a year-over-year comparison can reflect both market movement and composition. Before quoting a figure, return to the report or underlying source and preserve its precision and qualification.
Methodology for RE Luxe Leaders Luxury Real Estate Report
The report focuses on roughly the top third of U.S. markets and collects information monthly to identify trends at the area level. Its working categories are based on average sold prices: Executive Class areas at $750,000 and higher, Luxe areas at $2 million and higher, and Ultra-Luxe areas at $5 million and higher. These are report definitions for comparison, not a judgment about an individual property or client.
Use the method as a starting point for a market brief. Record the month, source, geography, and category; then add current local evidence before making a pricing, marketing, or investment decision.
Looking for our latest 12 month forecast down to the zip code?
The historical report points readers toward a more detailed forecast resource. Any current forecast should be checked at the time of use for its coverage, date, assumptions, and source. Do not carry a 2023 snapshot forward as if it were a current estimate.
Read the November 2023 report PDF alongside the Luxe Real Estate Reports page when reviewing the historical material.
Request a complimentary one-hour conversation with a senior advisor who is an experienced operator. Talk through your next move.