
December 2024 luxury real estate report
Historical edition: December 16, 2024. Explore selected city-level figures from the December 2024 RE Luxe Leaders luxury report and download the complete original data file. These figures belong to that historical edition.
The data file lists city and state entries with “Current Ave,” “YoY %,” “3 Yr %,” “5 Yr %” and “10 Yr %” columns. The four examples below preserve the printed figures and link to their source pages.
Read across a row
For Greenwich, the annual column is 4.40%, the three-year column is 12.73% and the ten-year column is 25.54%. Those are separate comparison windows. Reading them as interchangeable annual rates would change the report’s meaning.
| City / state | Current Ave | YoY % | 3 Yr % | 5 Yr % | 10 Yr % | PDF page |
|---|---|---|---|---|---|---|
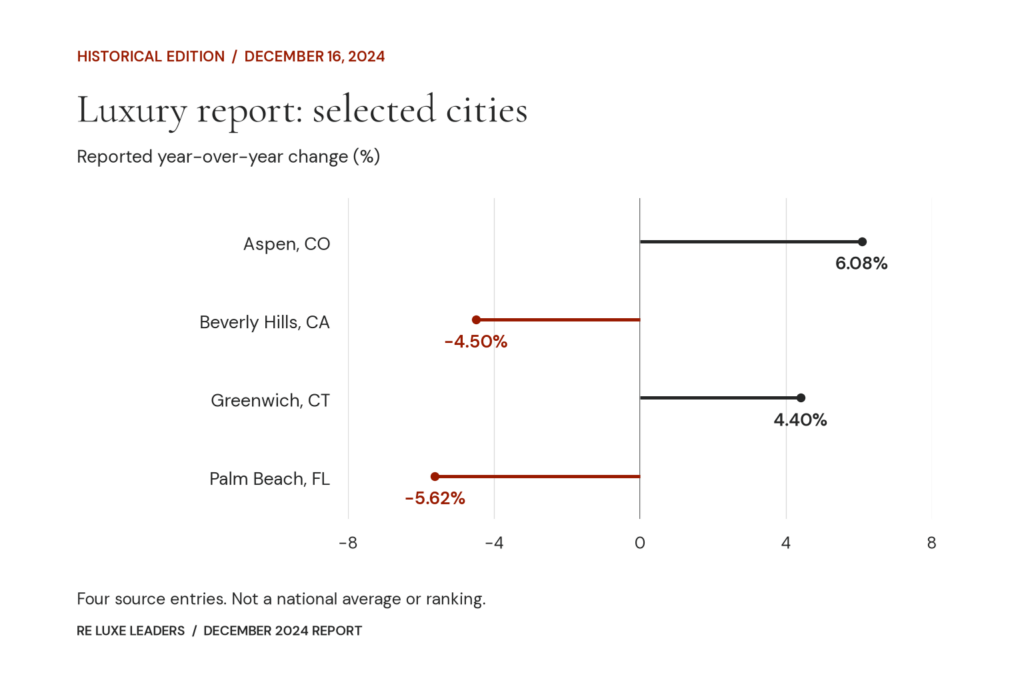
| Aspen, CO | $12,513,206 | 6.08% | 12.12% | 69.32% | 113.50% | 2 |
| Beverly Hills, CA | $8,735,155 | -4.50% | -8.98% | 7.72% | 91.30% | 3 |
| Greenwich, CT | $4,107,467 | 4.40% | 12.73% | 40.01% | 25.54% | 10 |
| Palm Beach, FL | $8,571,103 | -5.62% | 23.17% | 110.16% | 161.89% | 20 |
Beverly Hills shows -4.50% in the annual column and -8.98% in the three-year column, with positive five- and ten-year figures. Palm Beach has a negative annual figure beside positive longer-period readings. The selected rows demonstrate how the time window affects an interpretation; they do not measure national performance.
Find the entry you need
Download the original 55-page December 2024 luxury report (PDF). Search using the city and state together, then confirm the column and page before quoting a figure. The complete document is preserved in its original pagination, including pages that have little or no table content.
The source’s “Current Ave” dollar field describes an area entry. Its data pages do not explain the complete sampling or estimation method. Retain the original label instead of assigning it a more specific meaning, such as a verified transaction average or the value of a particular property.
Use the date as part of the evidence
The November 2024 edition supplies an earlier reference, and the January 2025 edition supplies a later one. Compare the same place and measure, and allow for changes in the source data or its coverage rather than assuming every difference is an observed change in sold prices.
The four places shown are reading examples, not a representative sample or ranking. Use the archive to examine the information recorded at the time; bring current local evidence to today’s operating and market-position decisions. To work through those decisions with an experienced advisor, Talk through your next move.