
February 2022 Luxe Real Estate Report
The February 2022 Luxe Real Estate Report is a dated market snapshot built from the top third of US markets. It is most useful as a record of the measures and categories used at that point in time, alongside local information that can be checked before making a decision.
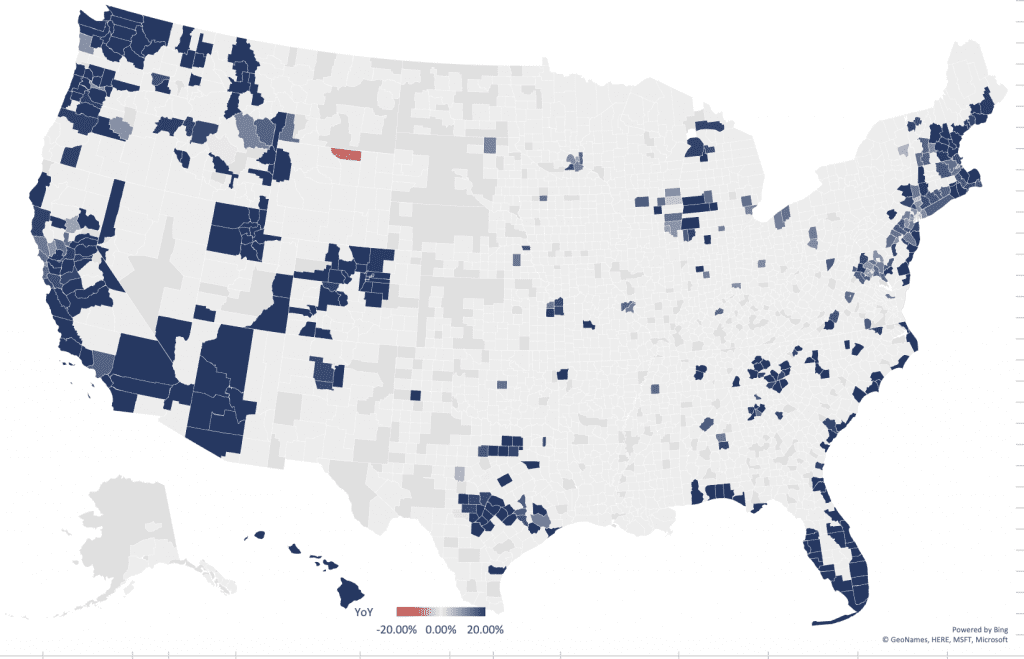
Year-over-Year National Luxe Real Estate Report Map
The January 2022 comparison records year-over-year movement across the national map. The report lists an 18.14% increase for its top-of-market measure, 21.33% for Executive Class Luxe, 20% for Luxe properties above $2 million, and 21.13% for properties above $5 million. These figures describe that dated report period; they are not a current market forecast.
What’s ahead?
The report’s 12-month projection was 17.30%, with demographic change and the flow of capital presented as the main themes. It also identified Florida’s coasts, Austin, the Carolina coasts, Nashville, Arizona, and the Idaho–Montana line as areas to watch. That list is a historical projection, so a current analysis should test each area against current inventory, pricing, financing, and local demand.
National Luxe Real Estate Forecast Map
The forecast map belongs with the dated projection above. Keep its legend and geographic relationships intact when using it as a reference, and label any newer comparison with its own date rather than blending two periods.
Here are the February 2022 Luxe Real Estate Report numbers for the data geeks
The report tracks three-year, five-year, and ten-year averages. It records 29.89% for the three-year luxe average, 41.82% for the five-year average, and 69.36% for the ten-year average. Treat each number as a dated observation with a defined denominator and market boundary.
2022-01 Luxe Report Data
Download the 2022-01 Luxe Report Data for the underlying reference. Keep the file’s date with any excerpt or calculation so a later reader can distinguish this snapshot from a current report.
Methodology
The report uses national data for the top third of each market and looks for area trends rather than treating one property as the definition of luxury. It divides markets into three categories:
- Executive Class: areas where average sold prices are $750,000 or higher.
- Luxe: areas where average sold prices are $2 million or higher.
- Ultra-Luxe: areas where average sold prices are $5 million or higher.
For a current decision, write down the geography, period, segment, source, and calculation before comparing markets. That simple record keeps a dated report useful without presenting it as a promise about what comes next.
Request a complimentary one-hour conversation with a senior advisor who is an experienced operator. Talk through your next move.