
January 2022 Luxe Real Estate Report
This article records the January 2022 National Luxe Real Estate Report, using December 2021 data. The figures and maps are historical; they describe the report’s period and should not be read as a current market forecast.
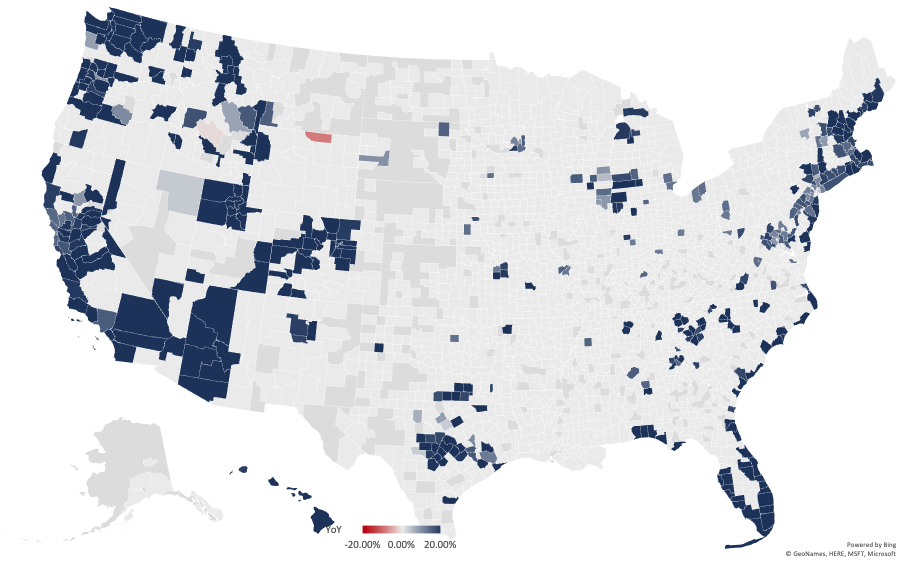
Year over Year National Luxe Real Estate Report Map
The report groups markets by the top third of local properties and compares year-over-year, three-year, five-year, and ten-year changes. Its December 2021 summary records 18.14% year-over-year growth for the top national market average, with an average price of $482,287; Executive Class Luxe is listed at 20.88%, Luxe at 19.20%, and Uber Luxe at 19.90%. These are dated report figures, not a claim about today’s market.
What’s ahead?
The report’s forward-looking section is a January 2022 scenario based on its own data and assumptions. It records a 16.40% expected national increase over the following twelve months and identifies demographic change, liquidity, interest rates, and regional supply and demand as factors considered by the report. Because this is a historical estimate, preserve its date when using it for comparison.
National Luxe Real Estate Forecast Map
The forecast map belongs with the dated report and its stated assumptions. Keep the map’s 20%/0%/−20% legend, county shading, insets, and map attribution visible wherever the image is used.
Here are the January 2022 Luxe Real Estate Report numbers for the data geeks
The report records three-year luxe averages up 28.44%, five-year averages at 40.29%, and ten-year averages at 64.09% for the period it examined. The report points readers to the accompanying data file for definitions and detail.
2021-12 Luxe Report Data
The report divides its historical comparison into Executive Class areas averaging $750,000 or more, Luxe areas averaging $2 million or more, and Ultra-Luxe areas averaging $5 million or more. Those thresholds describe the report’s categories and do not establish a universal definition of luxury.
Methodology
The stated method uses national data for the top third of each US market and compares area trends rather than individual property records. Read the December 2021 report data PDF with the publication date in view, and preserve the map legend and attribution when sharing the figures.
The report is most useful as a dated reference point: compare its definitions and observations with a newer, clearly dated report before making a present-day decision.
Request a complimentary one-hour conversation with a senior advisor who is an experienced operator. Talk through your next move.