
November 2021 Luxe Real Estate Report
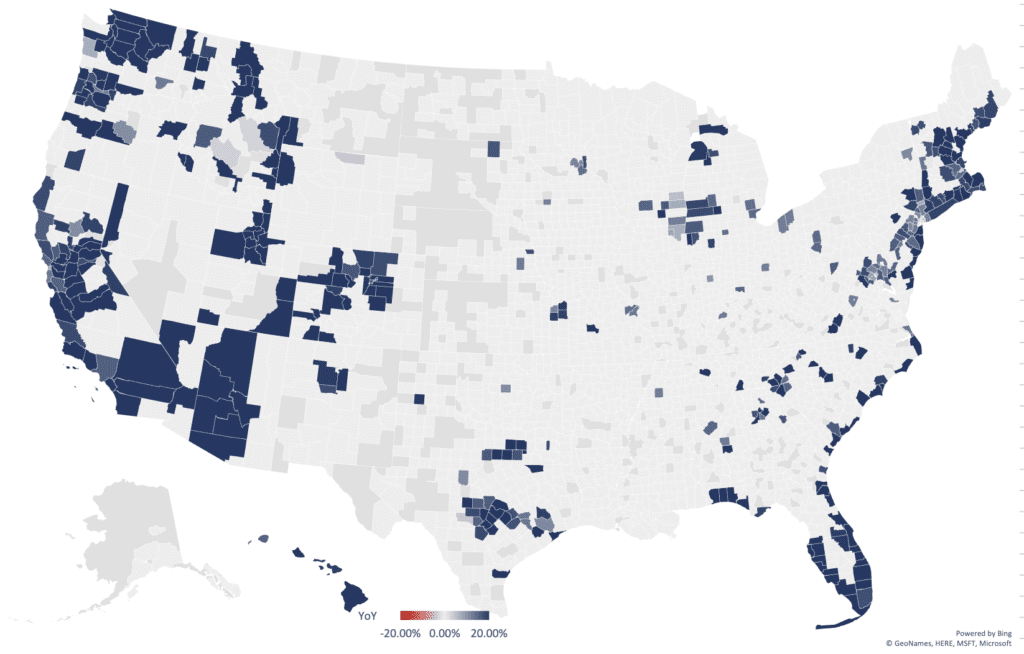
November 2021 Luxe Real Estate Report for November 2021 by the staff at RE Luxe Leaders
This dated report records a November 2021 view of luxury real estate conditions in the United States. It compares year-over-year, three-year, five-year, and ten-year patterns and separates the market into the report’s Executive, Luxe, and Ultra-Luxe categories.
The report is a historical reference. Use its definitions, maps, and supporting data to understand what the publication measured at the time; verify any current market decision against current primary data.
Year over Year National Luxe Real Estate Report Map
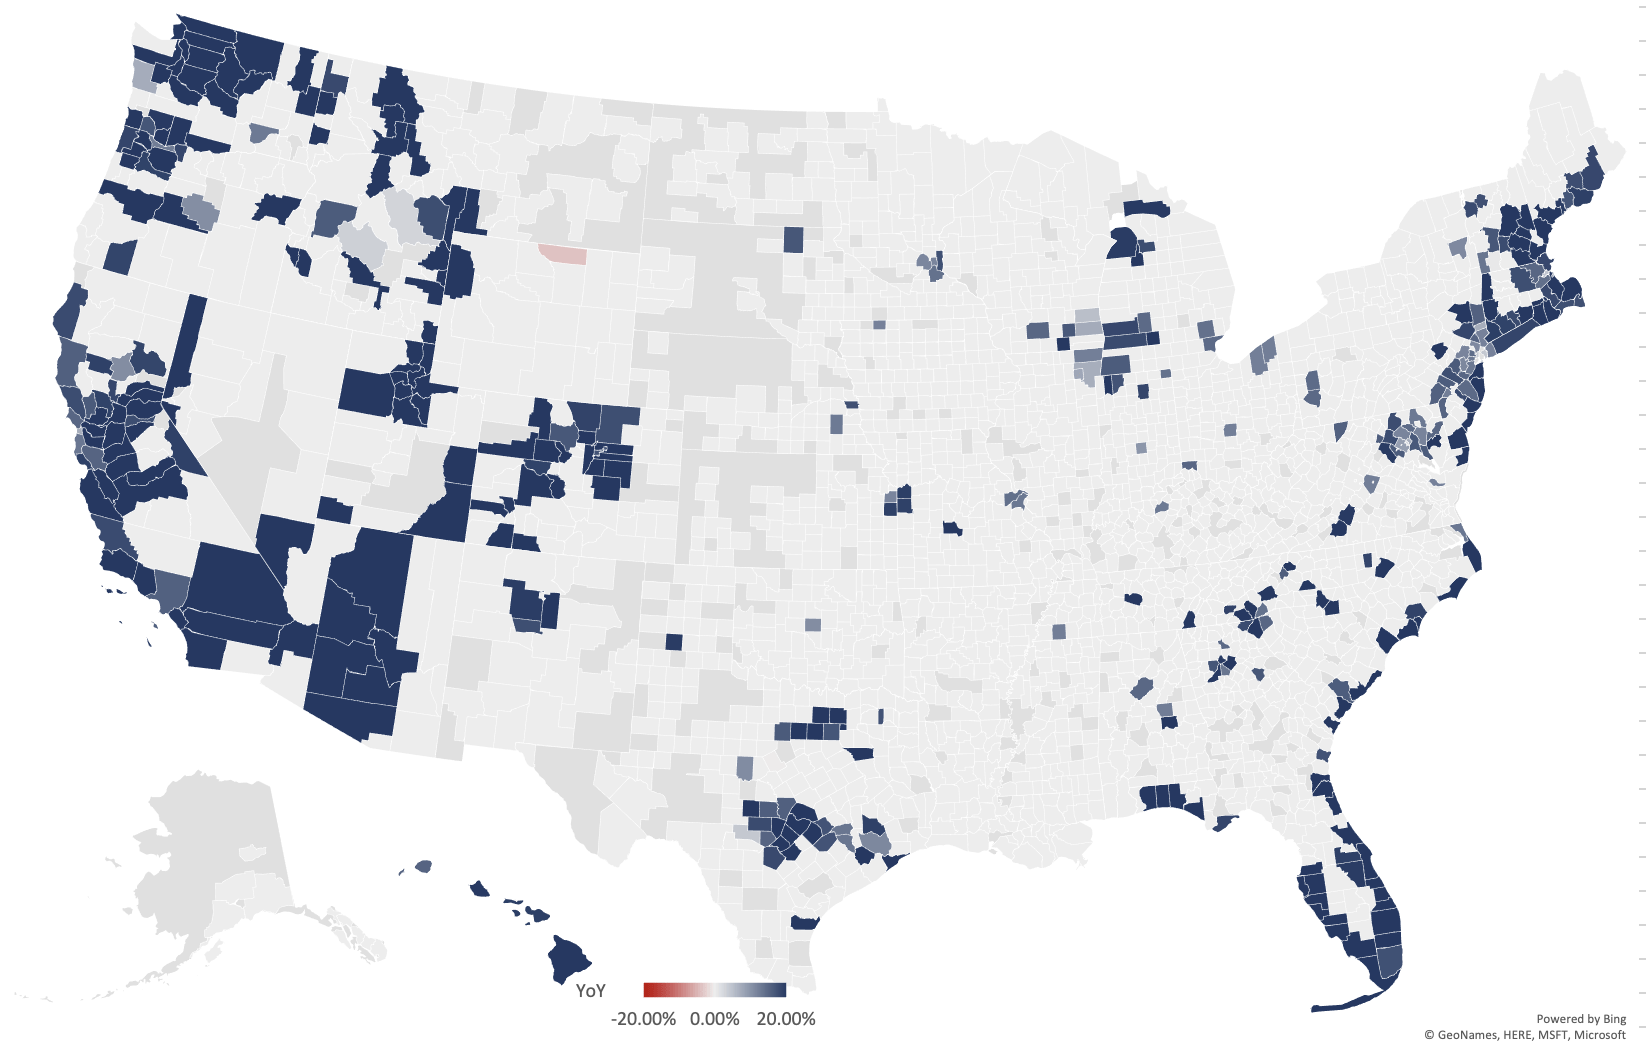
The map gives the report’s geographic view of the year-over-year data. Read the legend and boundaries together; do not separate a color from the period and category named by the report.
National Luxe Real Estate Forecast Map
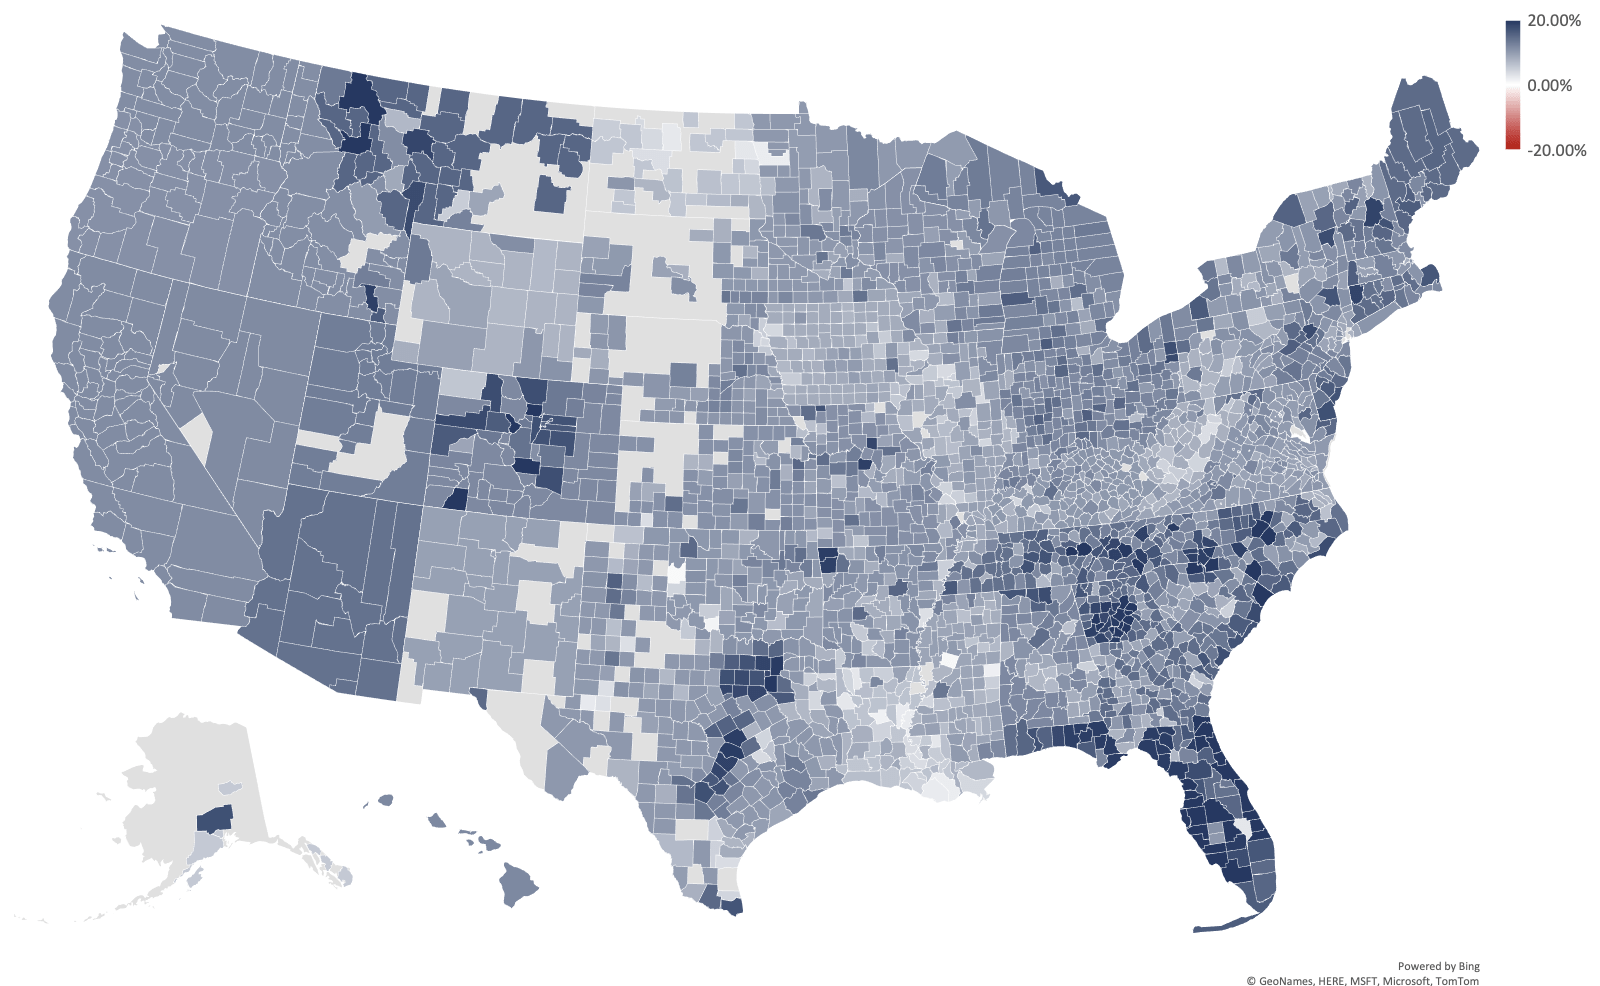
The forecast map shows the publication’s forward-looking view at that date. Treat it as a dated forecast and compare it with current local evidence before using it for advice.
Here are the National Luxe Real Estate Report numbers for the data geeks
The supporting report breaks out the national data it used for the top third of each market. Its category labels describe area trends rather than the value of any individual property.
Luxe Report Detail 2021-11
Methodology
The report describes a national sample based on the top third of each market and uses three category labels: Executive Class, Luxe, and Ultra-Luxe. The definitions and period belong to the November 2021 publication.
Request a complimentary one-hour conversation with a senior advisor who is an experienced operator. Talk through your next move.