
February 2025 luxury real estate report
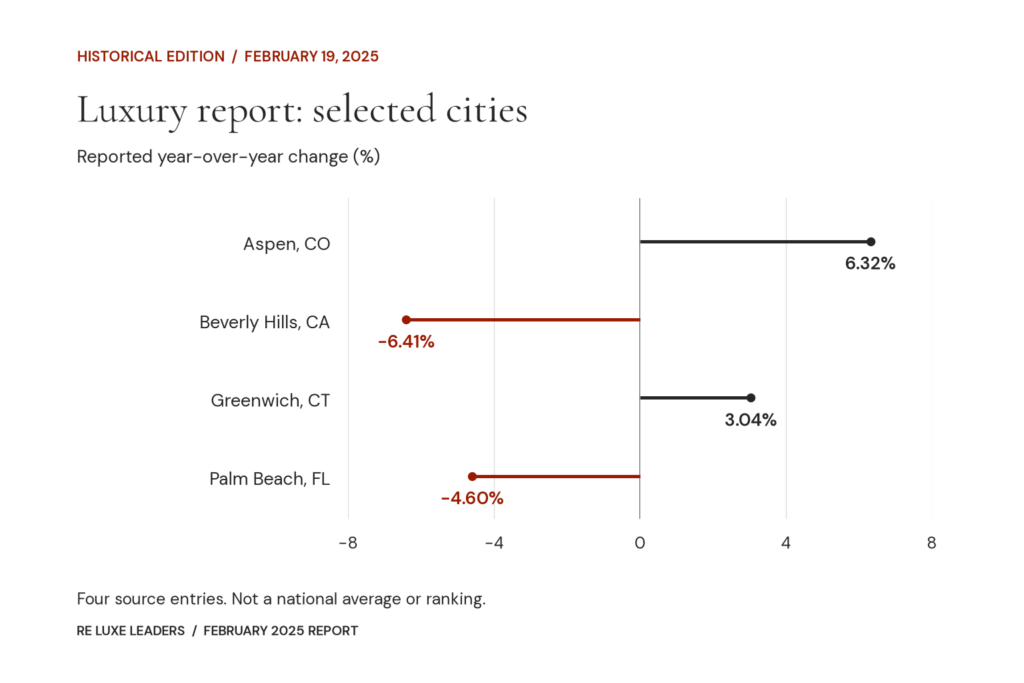
Historical edition: February 19, 2025. Explore selected city-level figures from the February 2025 RE Luxe Leaders luxury report and download the complete original data file. These figures belong to that historical edition.
The full report lists city and state entries with a dollar column labeled “Current Ave” and percentage columns for one, three, five and ten years. The four examples below show why the comparison period matters when reading an area-level figure.
Read the February figures
Beverly Hills has a negative year-over-year reading of -6.41%, alongside a positive five-year figure of 5.22%. Palm Beach also has a negative annual reading, -4.60%, while its five-year column shows 104.28%. These are different comparison periods. The longer-period percentages are not annual rates, and adding the columns would not describe a meaningful total return.
| City / state | Current Ave | YoY % | 3 Yr % | 5 Yr % | 10 Yr % | PDF page |
|---|---|---|---|---|---|---|
| Aspen, CO | $12,772,428 | 6.32% | 8.48% | 67.69% | 110.49% | 2 |
| Beverly Hills, CA | $8,796,364 | -6.41% | -13.17% | 5.22% | 82.25% | 4 |
| Greenwich, CT | $4,116,920 | 3.04% | 9.48% | 40.53% | 24.03% | 20 |
| Palm Beach, FL | $8,763,685 | -4.60% | 11.07% | 104.28% | 150.10% | 37 |
Aspen, Beverly Hills, Greenwich and Palm Beach are selected reading examples. They are not a representative sample, a national average or a ranking of the markets in the complete report.
Use the complete source
Download the original 55-page February 2025 luxury report (PDF). Search the PDF for the full city and state name. Keep the column heading and report date with any number you quote. A place name alone may be ambiguous, and a nearby county can describe a different area.
The preserved data file does not include a full explanation of the estimator or sampling behind “Current Ave.” Keep that label when using the table. It should not be silently relabeled as a particular home’s value, a current asking price or a verified transaction average.
Put a historical reading in context
The January 2025 edition provides an earlier city-level reference. The February 2025 forecast is a separate county-level document. Their dates, geographies and purpose matter before making a comparison.
Use this archive to understand what the report recorded at the time. A pricing or market-position discussion today needs current local evidence and the details of the actual property or business. To work through those decisions, Talk through your next move.