
August 2024 luxury real estate report
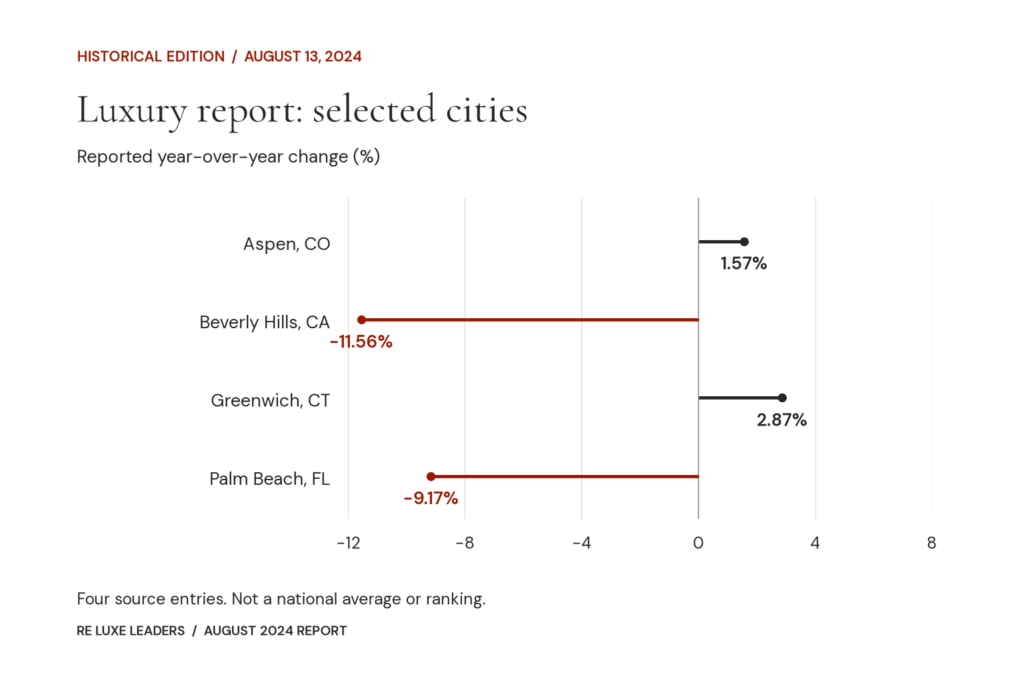
Historical edition: August 13, 2024. This page restores the subject of the August 2024 RE Luxe Leaders luxury real estate report using its original data attachment. The selected rows below retain the printed values and link to the pages where they appear.
The source includes a “Current Ave” dollar field and percentage comparisons over one, three, five and ten years. These examples describe the historical file. They do not establish an individual property’s value or a current market reading.
Reading the “turning a corner” question
The selected annual figures are mixed. Aspen shows 1.57% and Greenwich 2.87%, while Beverly Hills shows -11.56% and Palm Beach -9.17%. Their five-year readings are all positive. Four entries alone cannot establish a national turning point, and a positive longer-period comparison does not mean the annual reading is positive.
| City / state | Current Ave | YoY % | 3 Yr % | 5 Yr % | 10 Yr % | PDF page |
|---|---|---|---|---|---|---|
| Aspen, CO | $12,810,407 | 1.57% | 18.23% | 61.32% | 110.01% | 1 |
| Beverly Hills, CA | $8,742,668 | -11.56% | -4.77% | 6.06% | 95.33% | 1 |
| Greenwich, CT | $4,091,464 | 2.87% | 16.27% | 34.18% | 24.17% | 2 |
| Palm Beach, FL | $9,245,550 | -9.17% | 45.61% | 116.53% | 177.56% | 1 |
These four entries are selected reading examples, not a representative sample, ranking or national average. The table preserves the source labels and decimal precision so the figures can be checked directly.
Read the original report
Download the original 56-page August 2024 luxury report (PDF). Use the page links above for these examples, or search the complete file for another city and state. Keep the edition date with any figure quoted from this archive.
The file does not document the complete estimator or sample behind “Current Ave.” Preserve that label rather than describing it as a verified average of completed sales. A city-level figure alone cannot value a particular property.
The complete report contains repeated place labels with differing values. Those rows remain as printed; they should not be combined or silently resolved. Each of the four city-and-state pairs reproduced here has one unambiguous match in this edition.
A limit on comparisons between editions
The four selected rows have the same YoY, three-year, five-year and ten-year percentage values in the September 2024 report, although their “Current Ave” dollar values differ. The source files do not explain that combination. This archive preserves it without inventing a reason or recalculating the percentages.
Those repeated percentage fields do not demonstrate month-to-month stability. Resolving the underlying definitions and calculation dates would be necessary before using the two editions to draw that conclusion.
A present-day business decision needs current local evidence and a clear question. For help with market position, priorities or the next stage of your real estate business, Talk through your next move.