
Luxury Real Estate Report: August 2023 – Wealth Dynamics in America
Luxury real estate report: August 2023 – Wealth dynamics in America
This is a dated August 2023 report. Its figures describe that edition and should be paired with current local evidence before they inform a present decision.
The report reviews upper tier markets, regional movement, and the factors its authors associated with luxury demand. It is most useful as a historical reference when the reader keeps the period, geography, measure, and source visible.
Insights into leading luxury regions
The report compares a year of observations from August 2022 through July 2023. It describes different paths across places including Jupiter Island, Florida; Hunts Point, Washington; Atherton, California; Manalapan, Florida; and Golden Beach, Florida. The point is dispersion: a state or national direction does not describe every local market.
Top gainers
The edition lists Manalapan, Florida; Wilson, Wyoming; Hanalei, Hawaii; Lake Buena Vista, Florida; and Sea Island, Georgia among the places with the largest reported increases in its comparison. Treat those as the report’s period specific observations, not a current ranking.
Top decliners
Glenbrook, Nevada; Hunts Point, Washington; Malibu, California; Stinson Beach, California; and Atherton, California appear among the reported declines. A change in an area average may reflect its sample and definition, so inspect the underlying method before explaining a cause.
Highlights of housing price variations
The report’s city comparisons show why a luxury conversation needs a local frame. Its listed increases and decreases are approximate changes in the report’s area measures over the stated year. They can prompt a question about inventory, transaction mix, and timing; they cannot stand in for a valuation of an individual home.
An overview of states dominating the luxury segment
The edition counts luxury locales in several states and pairs those counts with year over year median price movement. California, New York, New Jersey, Massachusetts, Florida, Washington, Texas, Colorado, Hawaii, and Maryland are among the states discussed. The count is a definition from this report, not a census of every high value home.
A few insights on the international luxury market
The report describes lifestyle, location, condition, and amenities as considerations in luxury purchasing, and it discusses secondary residences and international buyers. Those are themes for research, not assumptions about a particular client. Ask what the client values, what can be verified in the relevant market, and what their adviser says about the transaction.
Navigating the luxury real estate landscape
Use a dated report to frame a conversation about supply, demand, pricing, and service. Put the report’s period beside any local comparison and distinguish an observation from an explanation. The strongest next step is often a narrower question with a better matched data set.
Diving deeper
The August 2023 Luxe Report PDF contains the edition’s supporting material. Read the document with the narrative and preserve the definitions when comparing another month.
Looking for the latest 12 month forecast down to the ZIP code?
The August 2023 national forecast resource is a companion historical reference. Check its date and method before placing it beside the report, and use current local evidence for a present recommendation.
Year over year national luxury real estate report map
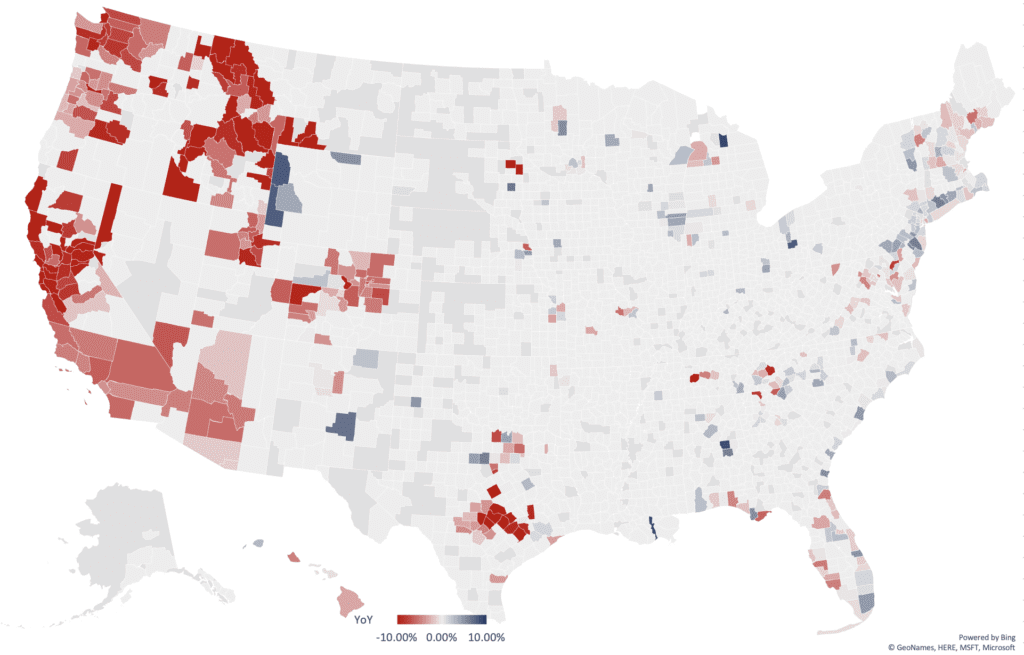
The map presents county shading with a year over year legend from −10.00% to 10.00%, plus Alaska and Hawaii insets. It carries visible “YoY” labeling and Bing, GeoNames, HERE, MSFT, and Microsoft attribution. Keep the complete map, legend, insets, attribution, and August 2023 context together when using it as an informational reference.
August 2023 report numbers
The numbers are meaningful only beside their period and scope. Record whether a comparison concerns an area median, an average, a change, or a count. Then compare it with an equivalent local measure rather than turning a single place into a national conclusion.
Luxury real estate report data: August 2023
Keep the table or document that supplies a figure with the explanation that interprets it. If a later edition changes the definition or coverage, preserve the old label so the historical comparison remains honest.
Methodology for the RE Luxe Leaders luxury real estate report
The report says it focuses on the top one third of U.S. markets and collects area level data monthly rather than analyzing individual properties. It defines Executive Class as average sold prices of $750,000 and higher, Luxe as $2 million and higher, and Ultra Luxe as $5 million and higher. Keep those definitions and the August 2023 date visible when comparing editions.
Parting thoughts
A historical report is a starting point for a better local question. Preserve the source’s period, method, and visual evidence, then add current records before advising a buyer, seller, or team. Good market intelligence makes uncertainty clearer and the next decision more disciplined.
Request a complimentary one-hour conversation with a senior advisor who is an experienced operator. Talk through your next move.