
Luxury Real Estate Report Dec 2023: Top 8 Emerging Trends in U.S. Luxury Real Estate
The December 2023 Luxury Real Estate Report is a dated view of U.S. luxury markets. Its value is in showing how a national picture can conceal substantial local variation. Read it as a historical reference, keep the period and definitions attached to every figure, and use current local data before making a pricing, acquisition, or development decision.
Luxury Real Estate Report Dec 2023: Top 8 Emerging Trends in U.S. Luxury Real Estate
The report combines monthly area-level observations with national context. It focuses on the upper portion of U.S. markets and compares price levels, year-over-year movement, longer-term change, regional variation, and a risk indicator. Those lenses are useful together: a single average or percentage cannot describe a whole market.
National Price Trends
Begin with the period, geography, property segment, and measure. An average sold price describes the selected area and sample; it is not a valuation for an individual property. When comparing two places, ask whether the underlying property mix, time window, and data treatment are comparable. Record the exact table or report page used so another reader can reproduce the comparison.
Year-over-Year Changes
Year-over-year movement helps identify direction, but it does not explain cause. A decline may reflect composition, timing, financing conditions, or a small number of sales; an increase may have a similar limitation. Pair the change with transaction count, local inventory, and a longer view where available. Label the result as a report-period observation rather than a current forecast.
Long-Term Appreciation
Three- and five-year comparisons put a recent change in context. They can show whether a market’s path has been steady, uneven, or concentrated in a particular period. Treat appreciation as a description of past prices, not a promise about the next cycle. For a client conversation, explain the comparison window and the assumptions before discussing what it might mean.
Decade-Long Growth
A ten-year view can reveal a different pattern from a one-year measure. It can also hide structural changes in neighborhoods, property stock, and data coverage. Use it to frame questions about durability and volatility, then bring the discussion back to the subject property, current comparable evidence, and the client’s time horizon.
National Market Dynamics
National context is a starting point. Mortgage rates, employment, migration, supply, and buyer preferences can affect regions differently. A national movement should prompt a local question: which segment, neighborhood, and price band does it describe? Keep the report’s date visible whenever a national statistic is shared.
Regional Variations
Regional comparisons become useful when the same definition is applied consistently. Compare a set of areas with a stated reason, such as geography, buyer profile, or property type. Avoid treating a region as uniform. The report’s map and tables make the variation visible; the next step is to verify the local story with a current, appropriately scoped source.
State-Specific Trends
State-level labels are broad. Rules, taxes, employment, land constraints, and local supply can differ sharply within one state. Use state observations to identify where further research is needed, then narrow to the relevant county, city, or market area. A careful brief names what the report measures and what it does not.
Market Risk Indicator
A risk indicator is a signal for deeper due diligence, not a prediction that a particular property will lose value. Review its horizon, geography, inputs, and threshold. Ask what evidence would confirm or challenge the signal, and communicate uncertainty to the client. The report references the CoreLogic risk resource; readers should consult the current methodology and data before relying on it.
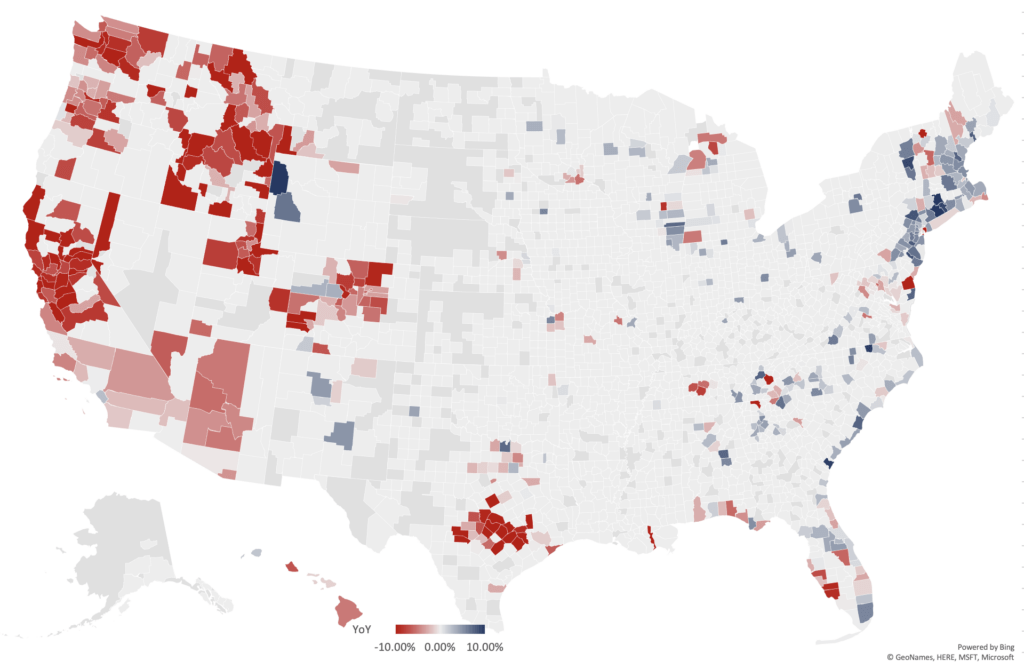
Year over Year National Luxury Real Estate Report Map
The report map is an informational reference. It uses a red-to-blue diverging key around zero and displays county-level variation across the United States. Preserve the legend and labels when the map is reproduced; a cropped or recolored version can change the meaning. The map belongs with the December 2023 report context.
Reading the 2023 Numbers
Readers who work with the underlying numbers should keep a small data note: date downloaded, area definition, measure, sample or coverage, and any exclusions. Separate the observed value from the interpretation. A table that looks precise still needs a clear denominator and period.
From a National Report to a Local Question
A forecast at ZIP-code level requires a different, current evidence set from this archived report. Start with the property’s market area, then compare current listings, closed sales, inventory, and relevant local conditions. Use the report to frame questions, not to fill gaps in current evidence. The national forecast discussion is a related historical reference.
Methodology for the RE Luxe Leaders Luxury Real Estate Report
The report describes monthly data focused on the top third of U.S. markets and analyzed at the area level rather than for individual properties. Its three labels are defined by average sold prices: Executive Class at $750,000 and higher, Luxe at $2 million and higher, and Ultra-Luxe at $5 million and higher. Those thresholds are the report’s classification rules for this edition. Keep them separate from a current appraisal or a claim about market performance.
Top 8 Emerging Trends in U.S. Luxury Real Estate
The report’s eight-trend framing is most useful as a checklist: national price movement, year-over-year change, longer-term appreciation, decade context, national dynamics, regional differences, state variation, and risk. The checklist encourages a more complete conversation than a single headline. Revisit each item with current, local evidence when the decision is current.
Parting Thoughts
A strong market brief says what was measured, where and when it was measured, what remains uncertain, and what the reader should verify next. Download the Luxe Report Dec 2023 PDF for the original tables and map, and preserve its December 2023 context in any quotation or reuse.
Request a complimentary one-hour conversation with a senior advisor who is an experienced operator. Talk through your next move.