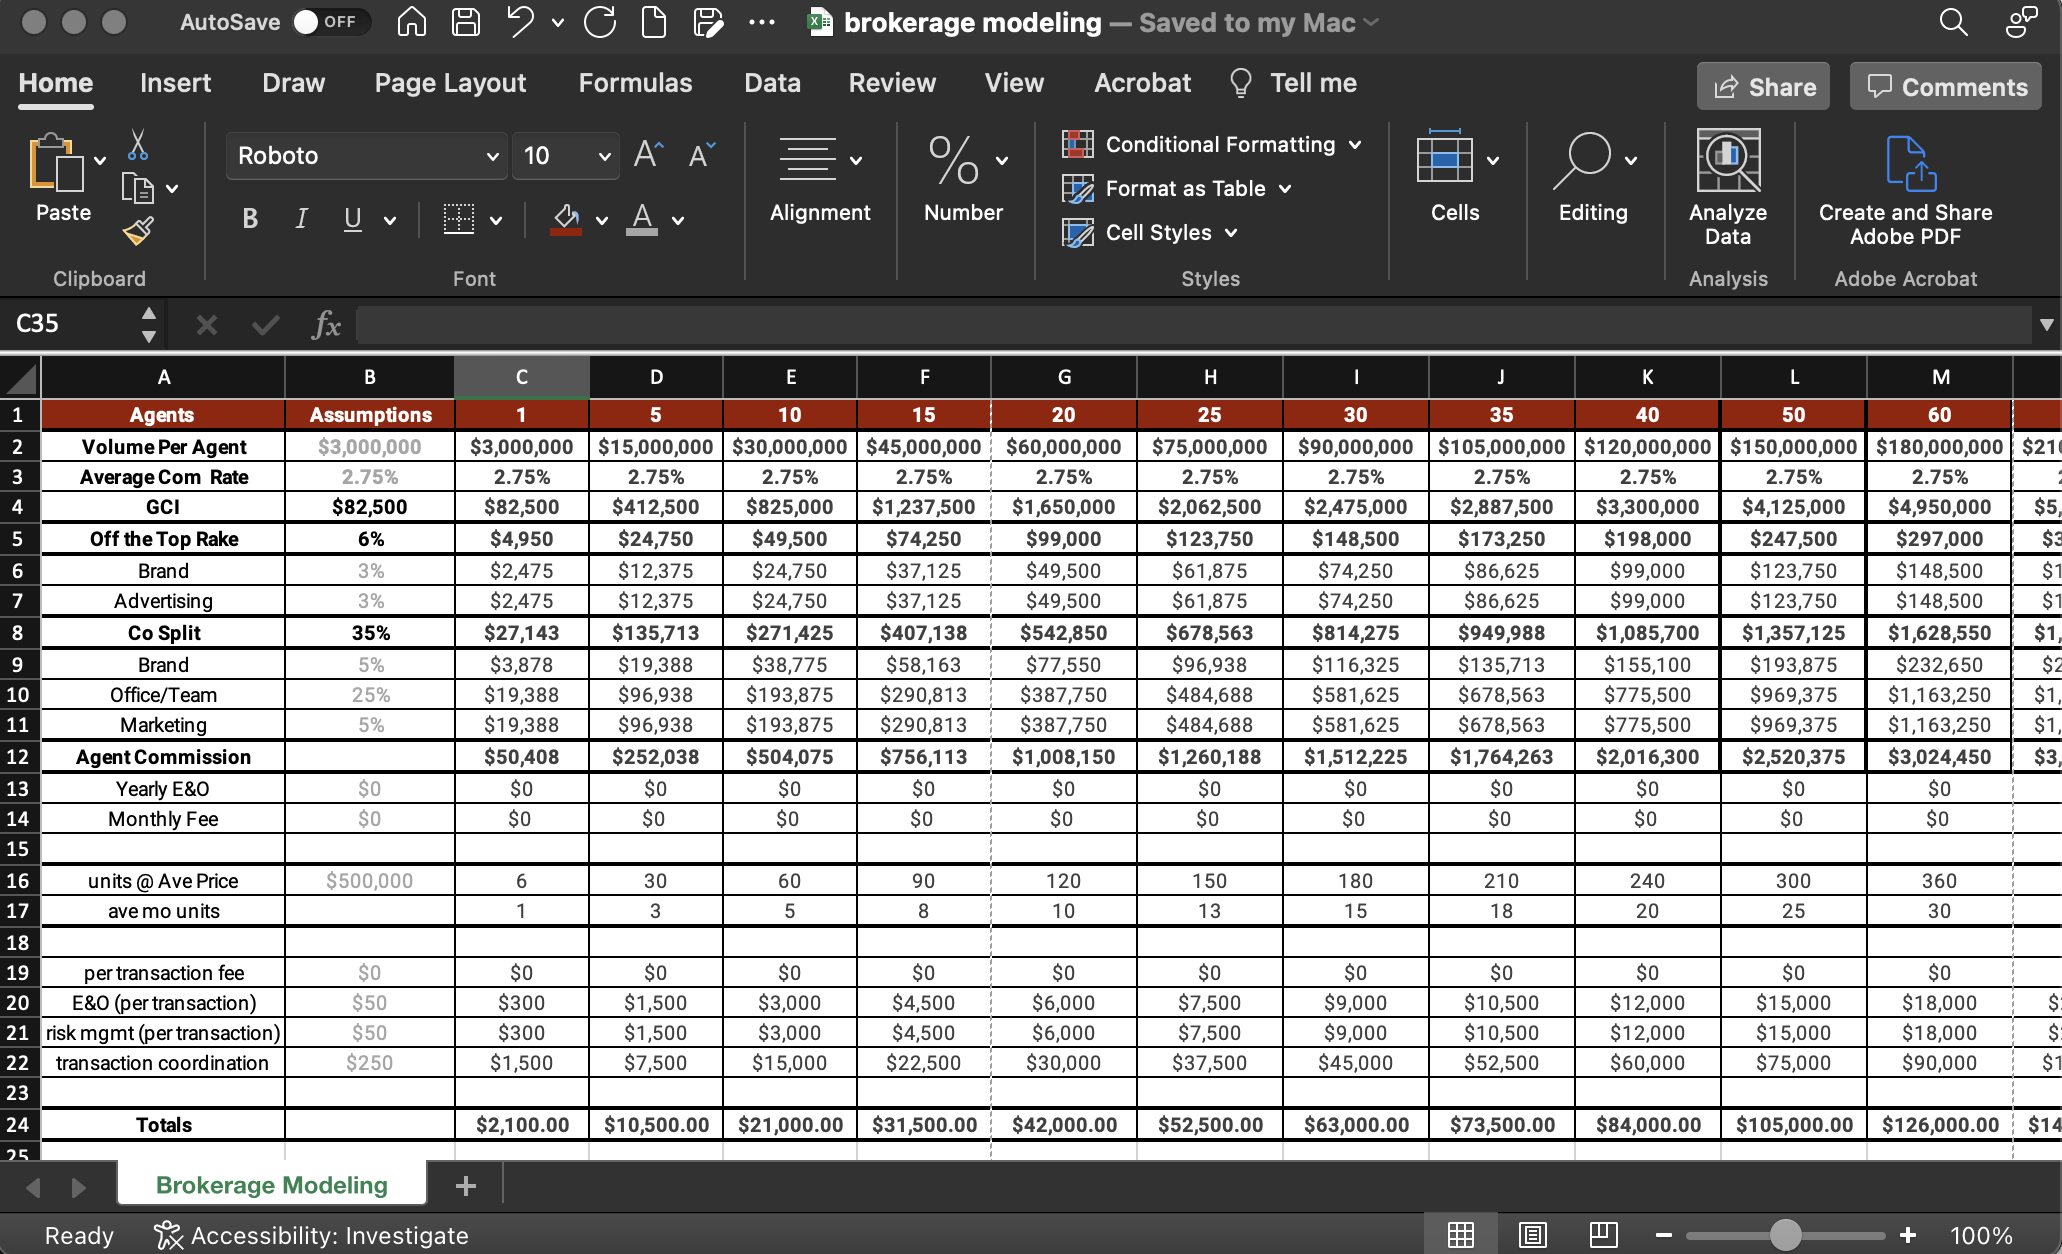
Our brokerage modeling tool was primarily designed for those who wanted to evaluate launching out on their own. But the model also works for teams to help them see how scaling growth can effect the bottom line.

The numbers in grey under assumptions are designed to be changed. The rest of the numbers will auto-calculate so you can get a picture of potential company dollar.
Let’s start with the assumptions.
Average volume per agent – This is going to be an average and guesstimate. If you don’t know, use $3 million.
Average commission rate – This varies across the country, use what is the average in your market. If you don’t know, use 2.5% to be safe with assumptions.
GCI – The Gross Commission Income auto calculates.
Off the Top Rake – This will auto calculate as a total. Many brands have a % they charge. Some brokers or teams will also charge and advertising fee off the top.
Company Split – This will auto calculate as a total. The Brand may have a percentage. The office or team may have a percentage. There might a percentage you charge for local marketing.
Yearly E&O – If you charge a yearly errors and omissions, put it in here.
Download our Brokerage Modeling Excel File
Monthly fee – If you charge a monthly fee, or fees, total them up and put them in here. The number will display on a per month value. You can multiply it by 12 to get the annual value by adding “*12” at the end of calculation.
Units @ Ave Price – Put the average price for your area in this and it will auto calculate your ave monthly units.
Per Transaction Fees – If you have a fee per transaction, it goes here.
E&O (per transaction) – If you have a per transaction E&O fee, put it in here.
Risk Management (per transaction) – If you have a fee per transaction for RM, it goes here.
TC Fee – If you charge a transaction coordinator fee, put it in here.


