
March 2025 Luxury Real Estate Report
The March 2025 RE Luxe Leaders report is a dated public data artifact, not a live market forecast. The linked PDF was created on March 18, 2025 and contains a national table of places with a current average value and year-over-year, three-year, five-year and ten-year percentage changes. Use it to understand the file’s as-of date and fields before drawing any current conclusion.
March 2025 Luxury Real Estate Report
This report is dated March 2025. The date stays attached to every figure so readers can distinguish the historical snapshot from a current market view.
Use the Report With Its Date Attached
The source page linked a twelve-month forecast and related report destinations. Those links should not be read as proof that this March 2025 file is current. Before using any figure for an acquisition, listing conversation or pricing decision, confirm the period, geography, definition of luxury and the source’s update date.
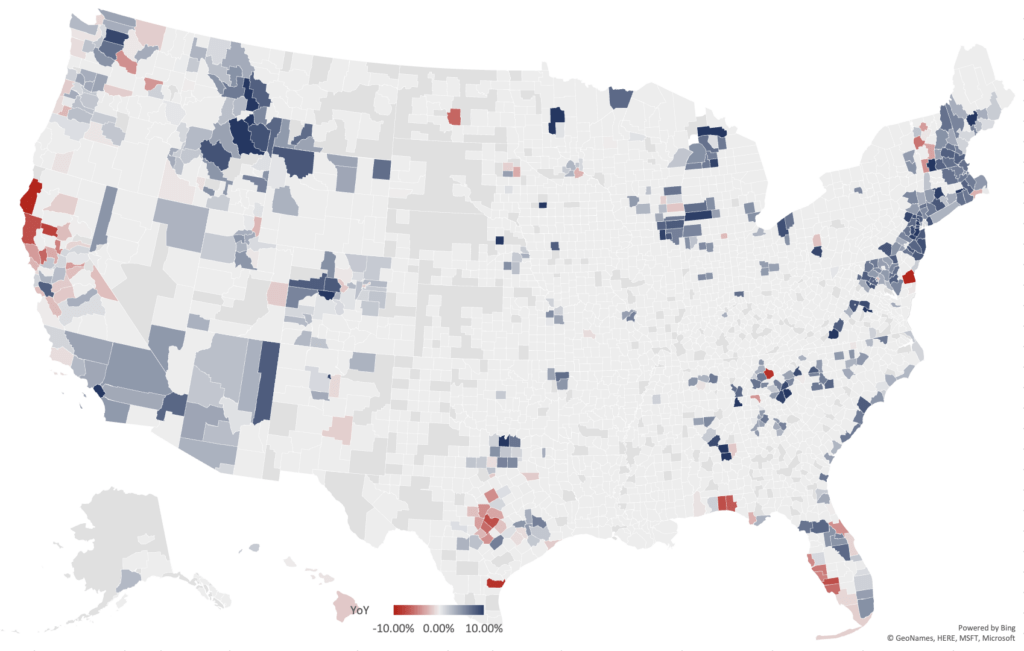
Year-over-Year National Luxury Real Estate Report Map
The report includes a year-over-year map by county or locality. Map colors are a visual summary; they do not explain why a place changed.
What the PDF Actually Contains
The PDF is titled “National Luxe RE Report – 3/18/25” and runs 55 pages. Each row contains a place, a current average and four comparison fields: YoY %, 3 Yr %, 5 Yr % and 10 Yr %. For example, the file lists Agoura Hills, California at $1,905,750 with 3.73% YoY, 7.59% over three years, 45.84% over five years and 70.19% over ten years. Aspen, Colorado is listed at $12,827,260 with 7.70% YoY, 6.58% over three years, 67.82% over five years and 108.97% over ten years. These are examples from the dated PDF, not current quotes or forecasts.
How to Read the Dataset
- Keep the as-of date with every copied value.
- Confirm that the place and comparison period match the decision.
- Distinguish a reported average from a median, index or transaction-level statistic.
- Use current local inventory, financing and comparable evidence before acting.
- Do not infer a cause from a percentage change alone.
Methodology and Review Questions
The linked PDF does not supply a complete methodological note for the table. A careful reader should therefore record the source population, calculation method, geographic unit, treatment of missing observations and the definition of “current average” before relying on a comparison. If those details cannot be reproduced, that limitation belongs beside the number.
Parting Thoughts
This report is useful as a dated snapshot and a prompt for better questions. It should not be presented as a live 2026 market view, a zip-code guarantee or investment advice. Preserve the original March 2025 PDF with the page.
Report links and context
- Read the March 2025 report PDF
- Compare the related March 2025 forecast page
- You can request a complimentary one-hour conversation with a senior advisor who is an experienced operator. Talk through your next move