
January 2025 luxury real estate report
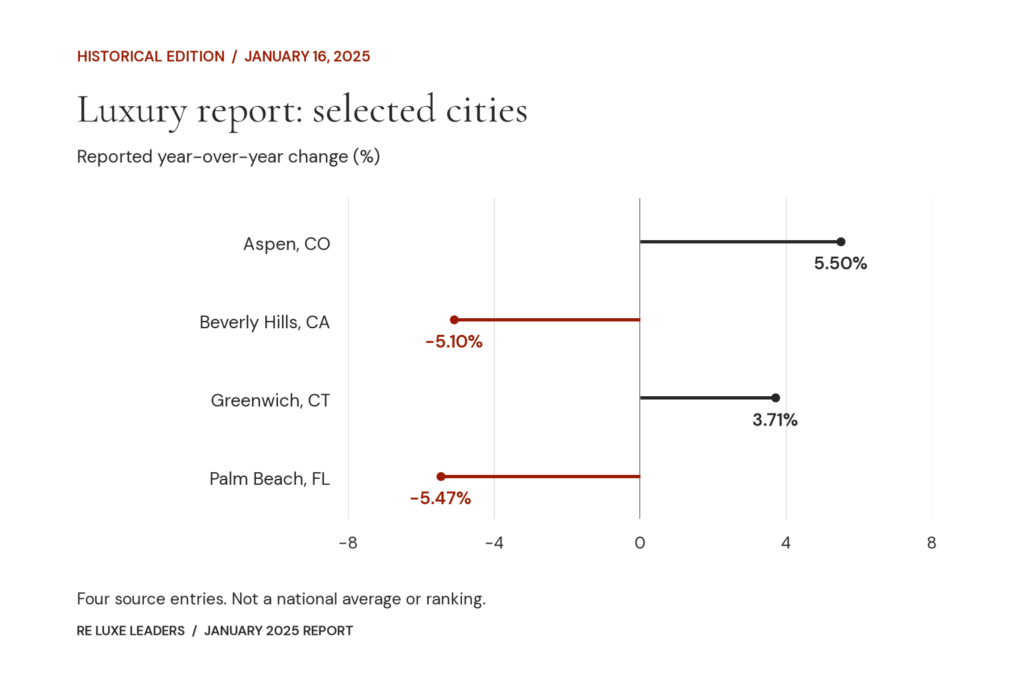
Historical edition: January 16, 2025. Explore selected city-level figures from the January 2025 RE Luxe Leaders luxury report and download the complete original data file. These figures belong to that historical edition.
The report presents city and state entries, a dollar field labeled “Current Ave,” and percentage comparisons covering one, three, five and ten years. The selected entries below retain those labels and every printed value.
Four entries from the January edition
In these examples, Aspen and Greenwich have positive year-over-year readings, while Beverly Hills and Palm Beach have negative readings. That contrast describes these four entries. It does not establish the direction of the country, a state or every property within one of these places.
| City / state | Current Ave | YoY % | 3 Yr % | 5 Yr % | 10 Yr % | PDF page |
|---|---|---|---|---|---|---|
| Aspen, CO | $12,585,262 | 5.50% | 9.97% | 68.54% | 112.09% | 2 |
| Beverly Hills, CA | $8,784,233 | -5.10% | -10.94% | 6.76% | 87.37% | 4 |
| Greenwich, CT | $4,093,215 | 3.71% | 11.12% | 40.55% | 25.07% | 20 |
| Palm Beach, FL | $8,520,361 | -5.47% | 17.24% | 107.04% | 156.54% | 37 |
Palm Beach’s -5.47% annual figure appears beside 17.24% over three years and 107.04% over five years. The time window changes the question being answered. A longer-period increase can coexist with a decline in the more recent annual comparison.
Keep the source labels with the figures
Download the original 55-page January 2025 luxury report (PDF). Use the PDF page links in the table to check each example, or search the complete document for a different city and state. The four places shown here were selected as reading examples, not as a representative sample or a list of the strongest markets.
“Current Ave” is the source’s column label. The preserved file does not provide enough methodological detail to rename it as a verified average of completed sales or use it as an individual property valuation. The dollar figures also concern different areas; they are not prices for equivalent homes.
Compare editions carefully
The December 2024 report and February 2025 report provide adjacent historical references. Check the exact area and column rather than treating a change between report editions as a complete account of what happened in the market.
The January county forecast has a different purpose and geography. Its issued figures are not a substitute for the city-level record here. For help connecting current market evidence to your business’s position, Talk through your next move.