
Feb 2024 Luxury Real Estate Report: Navigating the Complexities of the U.S. Luxury Real Estate Market
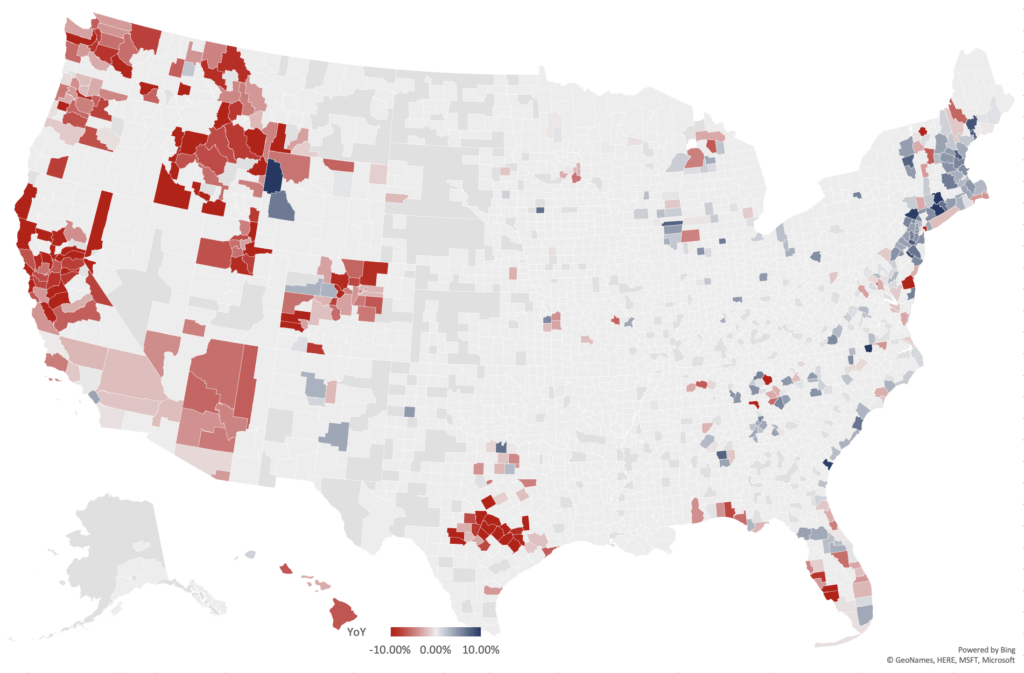
The February 2024 RE Luxe Leaders report is a dated snapshot of luxury home value movement from January 2023 to January 2024. Its usefulness is historical: it shows how broad national patterns can conceal sharp differences between metros, cities, and property segments. The figures below describe that report window and should not be read as a current forecast.
Use the report as a prompt for local questions. A market conversation still needs a current date, geography, property definition, and clearly identified data source.
What this February 2024 snapshot can show
The report divides the national luxury picture into Executive Class, Luxe, and Ultra-Luxe groupings based on the price levels described in its methodology. It examines area-level movement rather than individual properties. That distinction matters: a regional index can frame a question about a market, but it cannot price a particular home or predict one client’s result.
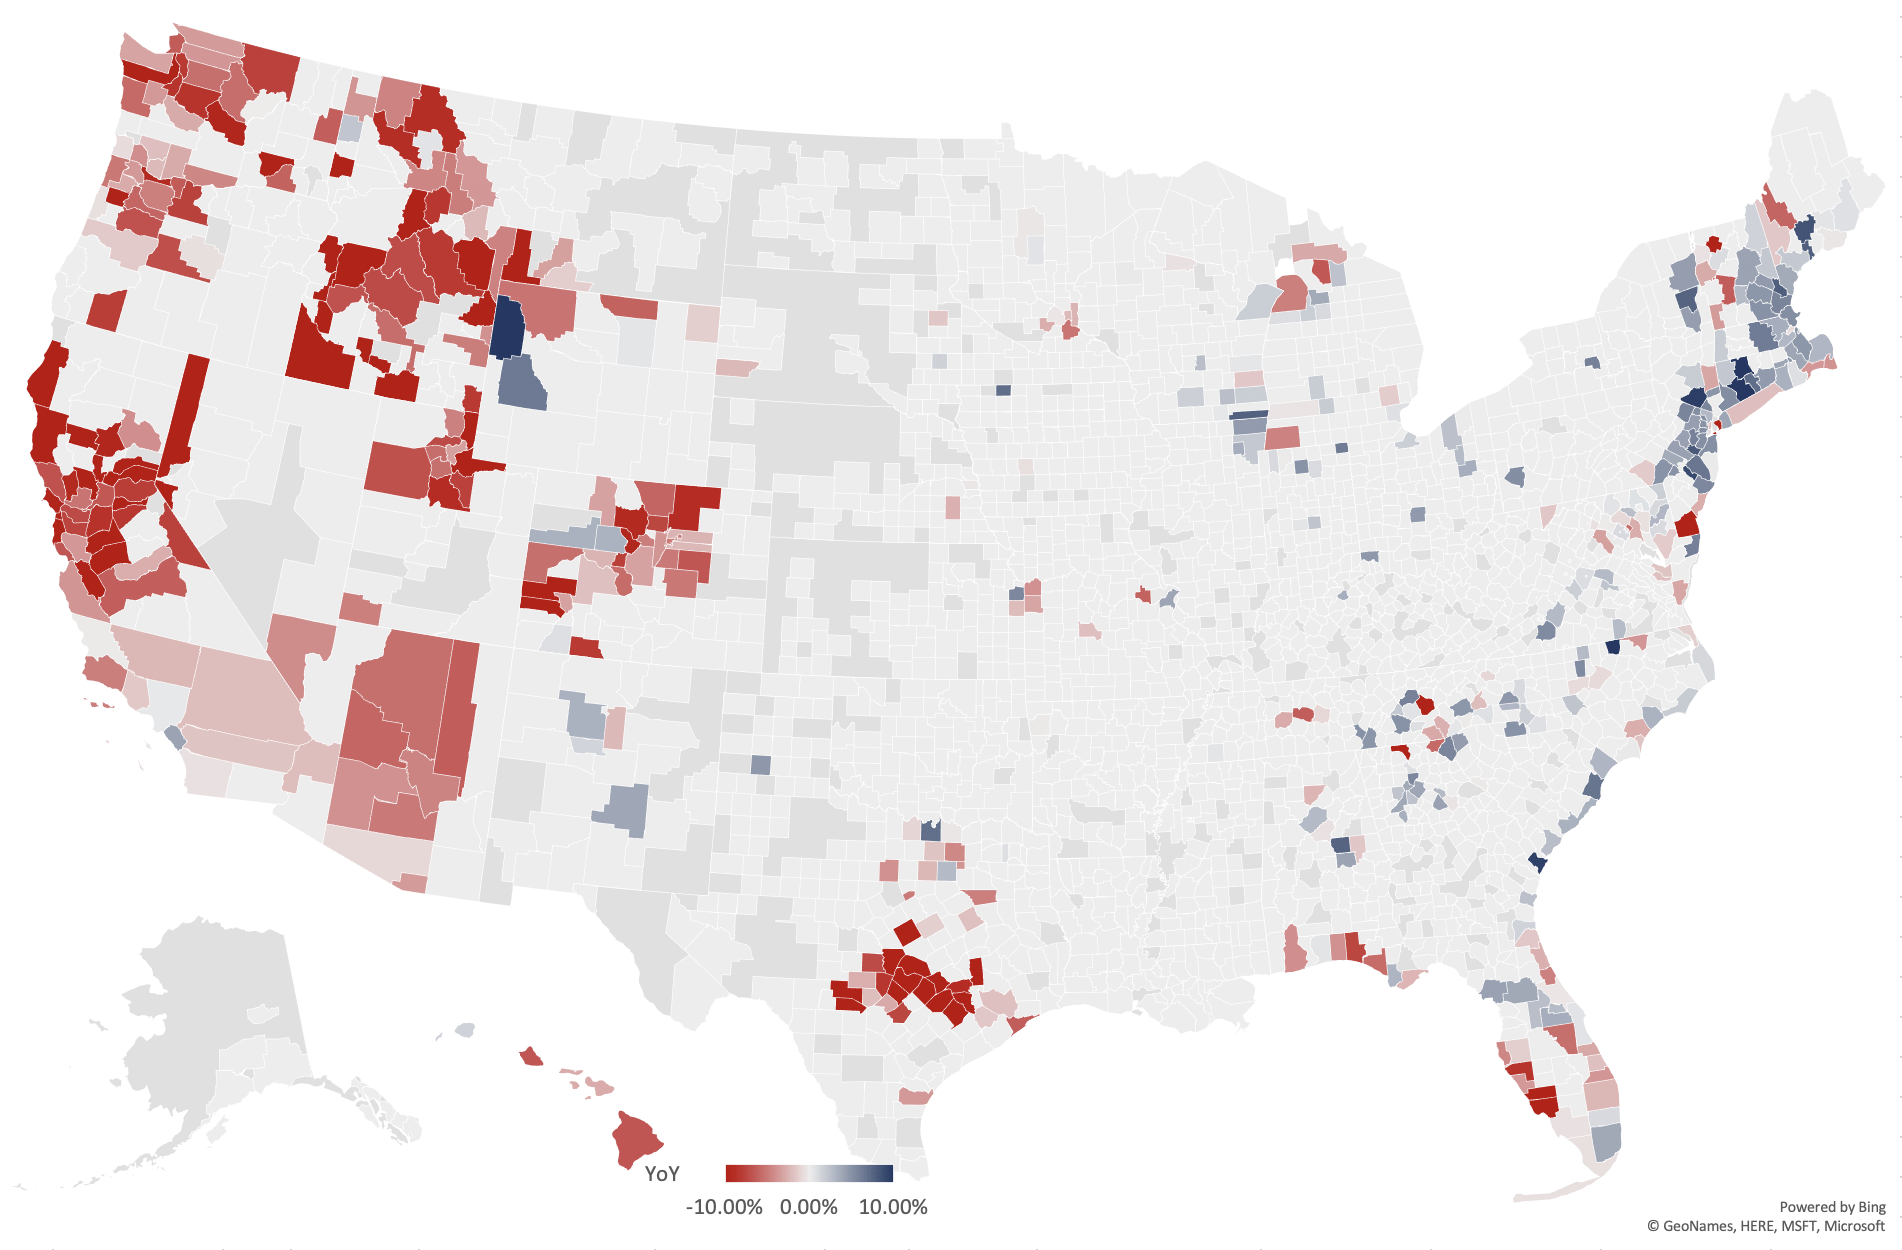
The map below is retained as the report’s factual visual reference. Its colors show the year-over-year pattern represented in the report; the labels and legend belong to that dated asset.
Regional movement in the report window
The report lists Jackson, WY-ID and Coeur d’Alene, ID among the metros with the largest increases in its January 2023 to January 2024 comparison, followed by Madison, WI, Savannah, GA, and Sandpoint, ID. It also lists Salisbury, MD-DE; Kennewick-Richland, WA; Ukiah, CA; Cape Coral-Fort Myers, FL; and Modesto, CA among the metros with the largest declines.
Those lists are useful because they show why a national summary needs local context. A brokerage using this report should confirm the current inventory, price band, and time window before applying a regional observation to a client conversation.
City level movement needs an even narrower lens
At the city level, the report identifies Alta, WY; Dover, ID; Harrison, ID; La Canada Flintridge, CA; and Okoboji, IA among the largest increases in the period. South Bethany, DE; Waccabuc, NY; Sanibel, FL; Pescadero, CA; and Boca Grande, FL appear among the largest declines. These are report-period index movements, not claims about every property or every neighborhood in those places.
Read disparities alongside the economic setting
Interest rates, inflation, supply, demand, and buyer preferences can influence how a luxury index moves. A report can identify a pattern without proving which factor caused it. Separate the observation from the explanation, then ask what current local evidence would confirm or challenge the story.
Sales volume and sale price can also move in different directions. A lower number of transactions does not by itself establish that property values fell, just as a higher median does not describe every home.
Turn a dated report into current questions
For a current briefing, pair the historical snapshot with today’s mortgage activity, interest rate environment, inventory, time on market, and local transactions. State the new observation date and keep the 2024 report as context. That gives a client a transparent way to distinguish what the earlier report recorded from what the brokerage is seeing now.
Top five metro increases in the report
- Jackson, WY-ID
- Coeur d’Alene, ID
- Madison, WI
- Savannah, GA
- Sandpoint, ID
Top five metro declines in the report
- Salisbury, MD-DE
- Kennewick-Richland, WA
- Ukiah, CA
- Cape Coral-Fort Myers, FL
- Modesto, CA
Top five city increases in the report
- Alta, WY
- Dover, ID
- Harrison, ID
- La Canada Flintridge, CA
- Okoboji, IA
Top five city declines in the report
- South Bethany, DE
- Waccabuc, NY
- Sanibel, FL
- Pescadero, CA
- Boca Grande, FL
Find the report’s related forecast
The original report links to a 12-month forecast by ZIP code. Read any forecast with its publication date, methodology, geography, and assumptions visible. Open the related February 2024 forecast for the historical companion resource.
Use the map as a conversation aid
When showing the map, name the period and explain the legend before discussing a region. A visual can help a client ask a better question, but its color field is not a substitute for a current property analysis.
Keep the numbers with their definitions
Every number in a market briefing needs a defined population, threshold, date, and geography. The report’s top-third market focus and price groupings are part of its methodology. Copying a number without those definitions changes what it means.
Read the accompanying data file
The accompanying Luxe Report February 2024 data file is the report’s supporting reference. Preserve the file’s date and definitions when using any table or figure in a later briefing.
Start with methodology
The report says it uses monthly area-level data focused on the upper portion of U.S. markets and separates Executive Class, Luxe, and Ultra-Luxe groupings by the price levels described above. Those choices shape the result. A reader should know them before treating the map or ranked lists as evidence for a local decision.
Let the snapshot sharpen the next question
The February 2024 report is most useful when it makes a conversation more precise. Ask what has changed since its window, what current local records show, and which assumptions need testing. For a focused discussion about turning market information into a clear client briefing.
Request a complimentary one-hour conversation with a senior advisor who is an experienced operator. Talk through your next move.