
January 2024 Luxury Real Estate Report: Navigating the Complexities of the U.S. Luxury Real Estate Market
January 2024 Luxury Real Estate Report: Navigating the Complexities of the U.S. Luxury Real Estate Market
This January 2024 report is a point-in-time view of the U.S. luxury market. It is most useful when read as a map of differences between places and time horizons, then paired with local evidence before a decision is made.
The report builds on the December 2023 edition and organizes the discussion around national price movement, year-over-year change, longer-term appreciation, regional variation, state-level patterns, and a market-risk indicator. The practical message is simple: a national headline cannot stand in for the conditions of a particular county, price band, or client situation.
National price trends need a local reading
Luxury markets can move in different directions at the same time. A national summary can establish the question, but it cannot tell a seller how a specific neighborhood is absorbing inventory or tell a buyer whether a property’s setting changes the comparison set. Start with the local area, the relevant property type, and the period being compared.
Year-over-year changes are one lens
A year-over-year measure is helpful for a recent direction of travel, yet the comparison depends on the starting month and the mix of properties in each period. Pair it with current listings, completed transactions, days on market, and the client’s actual objective. That combination gives a conversation more shape than a single percentage.
Long-term appreciation deserves a time horizon
Three-, five-, and ten-year views answer different questions. A longer series can show how a place behaved through more than one market cycle, while a shorter series may better describe the decision in front of a current client. Keep the horizon visible in every chart or memo so that a long-run pattern is not mistaken for a near-term expectation.
Decade-long growth is context, not a promise
Historical appreciation can help a brokerage explain why location and scarcity matter, but it does not guarantee the next decade. Use it to frame questions about infrastructure, land use, employment, inventory, and buyer depth. Then separate what the record shows from the judgment being made today.
National dynamics shape the conversation
Economic conditions and demographic movement influence luxury housing, even when the effect arrives unevenly. A useful briefing connects the broad backdrop to a client decision: which assumptions changed, which choices remain open, and what evidence will be reviewed next.
Regional variations change the conclusion
Compare regions with the same definitions before drawing a conclusion. Coastal, mountain, urban, and resort markets can have different supply patterns and buyer motivations. A regional page should identify the geography, period, property group, and measure so the reader can understand the comparison.
State-specific trends need a market-area check
State summaries are useful for orientation, while local market areas carry the decision. Ask whether a state-level result is being driven by a small set of counties, a changing property mix, or a particular price tier. That check prevents a broad label from hiding a meaningful local difference.
Use the risk indicator as a prompt
A risk label should start a discussion about evidence and exposure. Review liquidity, time horizon, leverage, condition, and the depth of the likely buyer pool. Let the client’s circumstances determine the next question rather than turning one historical trend into a universal ranking.
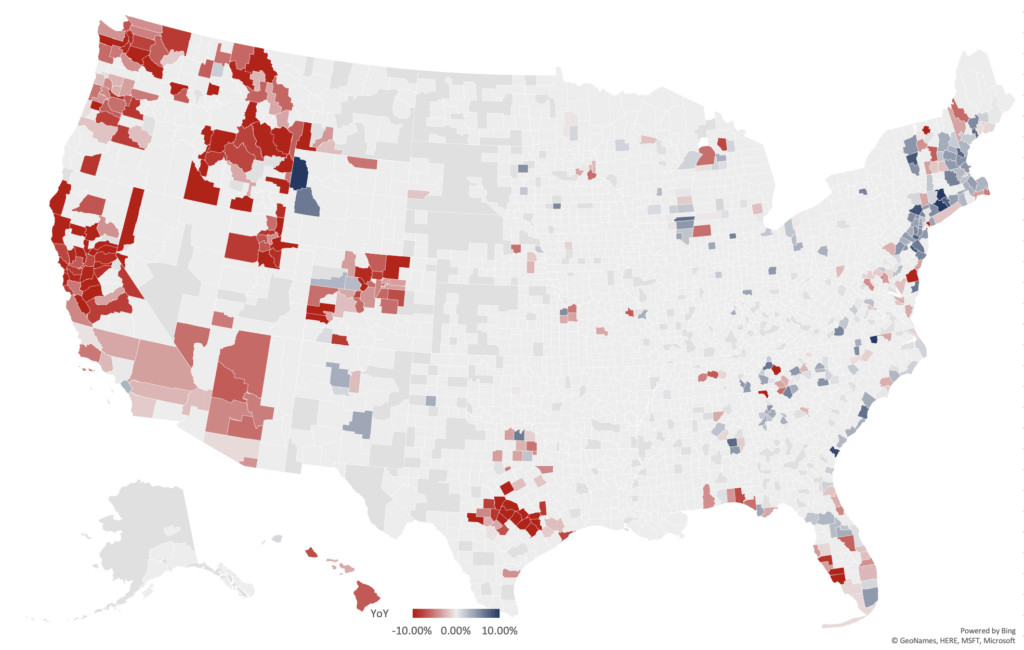
Year-over-year national luxury real estate report map
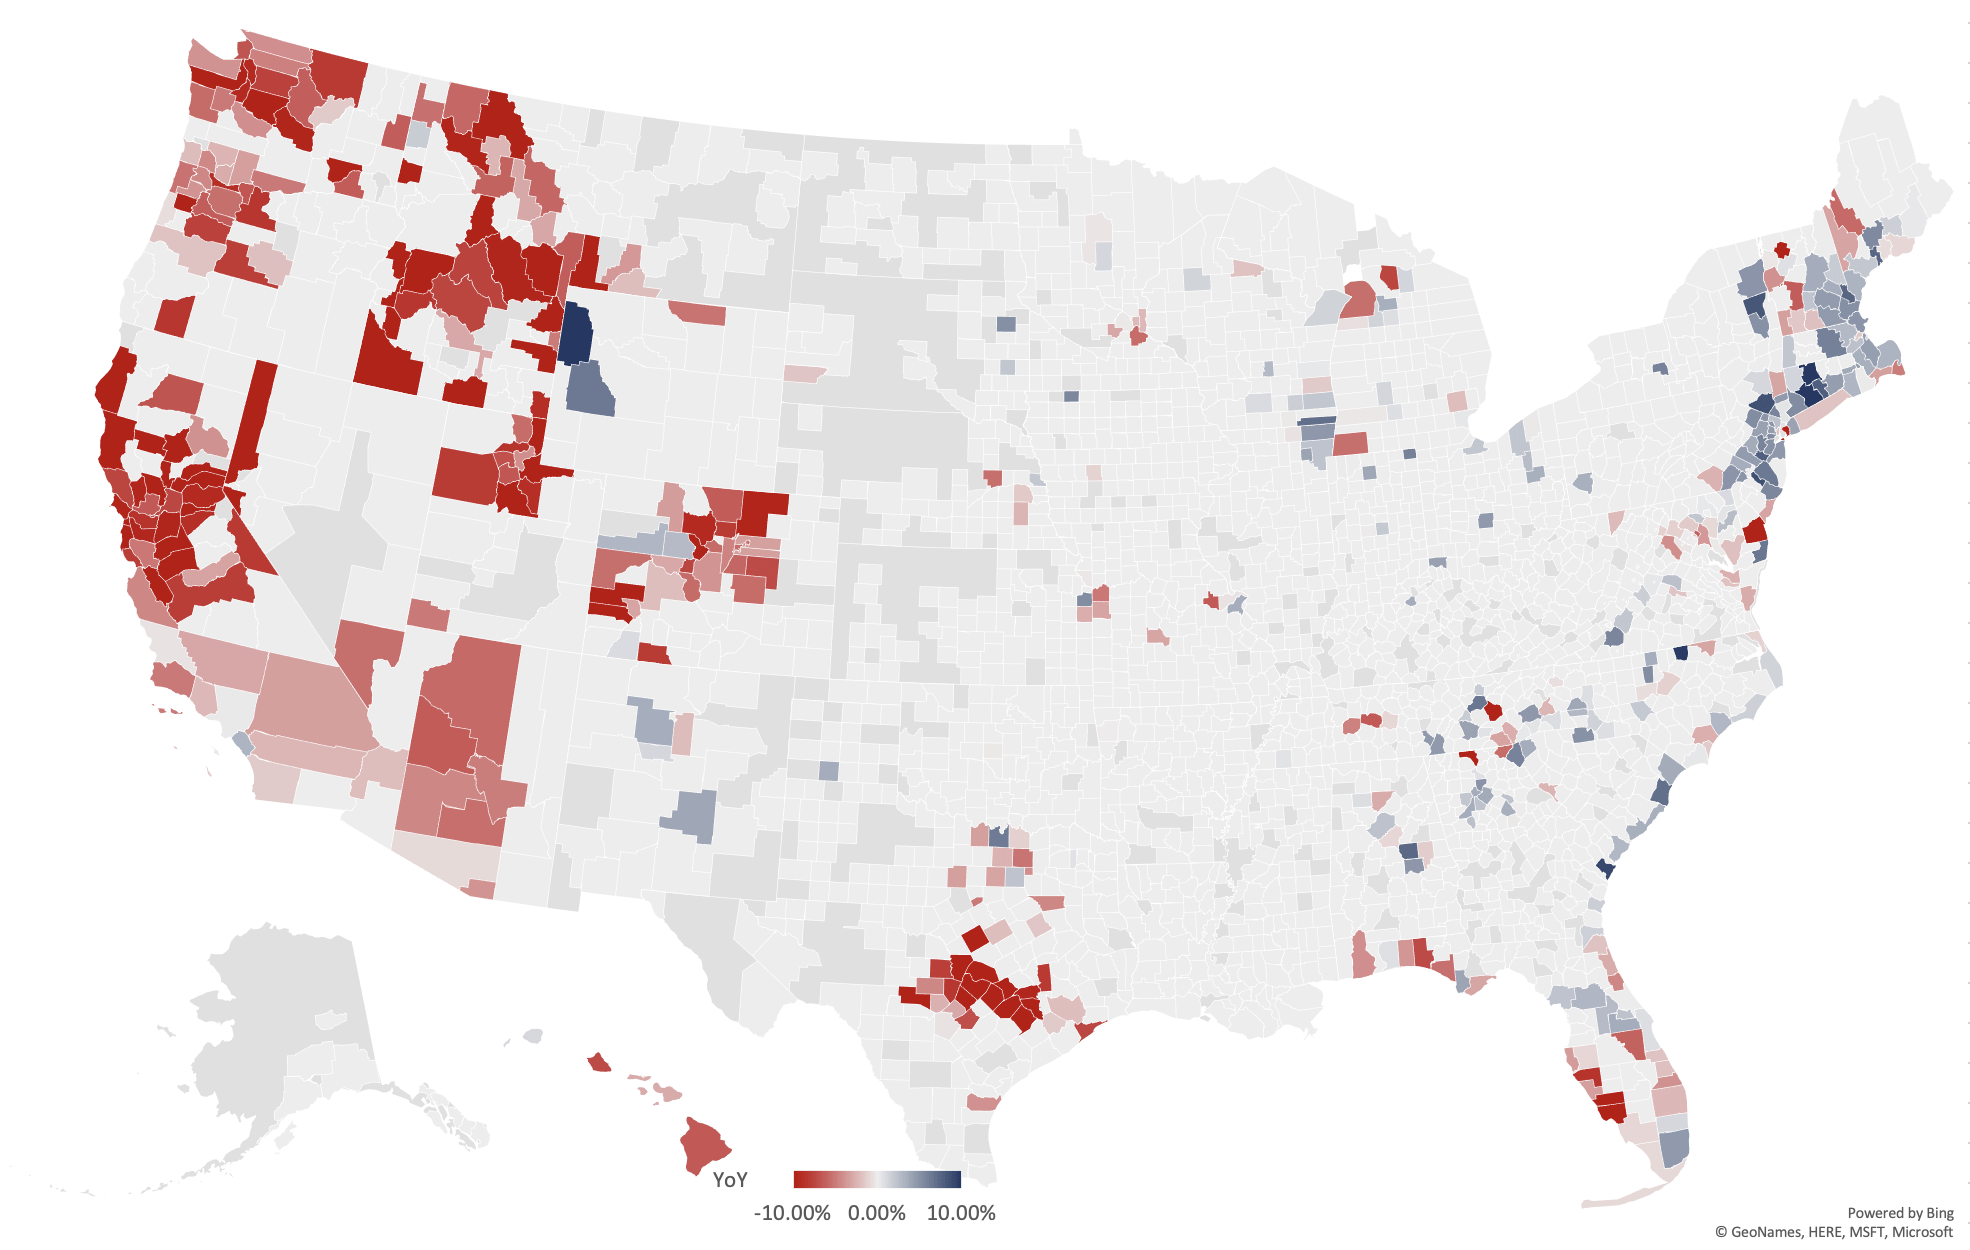
The map is a visual starting point. Read its geography and legend alongside the report definitions, and avoid treating a colored county as a prediction for a particular property.
Where the underlying numbers fit
The companion January 2024 data workbook is the place to inspect the report’s underlying tables. Keep the workbook’s date and definitions with any excerpt that is shared with a client or team.
Methodology for the RE Luxe Leaders luxury real estate report
The report describes a monthly process focused on roughly the top third of U.S. markets and analyzed at the area level rather than the individual-property level. It divides the national luxury view into three dated categories: Executive Class areas with average sold prices of $750,000 or more, Luxe areas at $2 million or more, and Ultra-Luxe areas at $5 million or more. Those definitions should travel with the data whenever the report is used.
Move from national context to the relevant forecast
For a more granular, dated view, read the January 2024 national real estate forecast. Use it as a separate piece of analysis and keep its period distinct from this report.
Luxury real estate report: parting thoughts
Good market advice makes the frame clear, names the evidence, and leaves room for a client’s priorities. For practical training context, explore the luxury real estate certification resources.
Request a complimentary one-hour conversation with a senior advisor who is an experienced operator. Talk through your next move.