
Luxury Real Estate Report: June 2023 – A Guide to Success in the US Market
Luxury Real Estate Report: June 2023 – A Guide to Success in the US Market
This June 2023 report is a dated market snapshot. Read its categories, map, and methodology together, then separate what the report measured from what a current decision requires today.
Read the market as a set of segments
The report describes different price bands and regional conditions rather than one national story. Use that framing when reviewing a market note: identify the geography, property band, period, and denominator before treating a movement as a signal.
Put inventory beside price
Price movement is easier to interpret when supply, seasonality, and the mix of properties are visible. Ask which areas and property types changed, whether the comparison is year over year or month over month, and what the data leaves out.
Look for new thresholds carefully
A market crossing a threshold can be a useful observation, but it is not a forecast for every property. Record the month, threshold definition, and areas included before using a change to guide conversations with owners or buyers.
Use a longer window
Longer averages can show direction that one month cannot. Keep the time window, selected markets, and calculation beside the number so a reader can distinguish a descriptive history from a promise about future returns.
Treat international signals as context
Cross-border demand is shaped by currency, travel, tax, regulation, lifestyle, and local supply. Use broad observations to form questions for a qualified local expert, not to infer a person’s intent or predict a transaction.
Turn a report into a decision brief
For a client or leadership meeting, summarize the period, geography, definitions, key movement, and one decision the information can support. Add the uncertainty and the next source you will check before acting.
Ask what the deeper analysis adds
A presentation or keynote can explain the choices behind a report. Preserve the underlying data and method, and write down which question the additional analysis answers before repeating its conclusion.
Keep current forecasts separate
A current forecast belongs in a current review. Link to the latest approved report when one is available and label the June 2023 snapshot as historical so readers do not confuse the two.
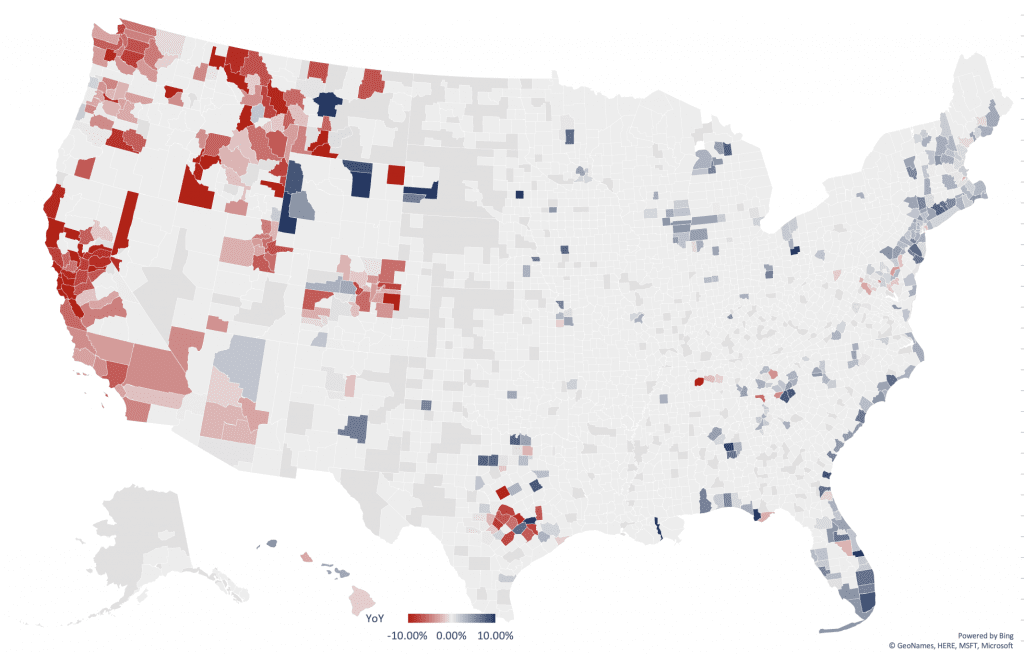
Read the map with its legend
A map is evidence only when its legend, period, geography, and category definitions travel with it. Keep those elements together in any crop or social derivative and do not infer a property-level conclusion from an area-level map.
Keep the data trail
Record the source file, collection period, market selection, and category definitions beside any figure you quote. The companion June 2023 data file is part of that dated trail.
Use the data file as a reference
A data table is most useful when the reader can see its fields and limits. Check whether a number describes an average, a threshold, a change, or a count, and keep the original date in the working note.
Make methodology visible
State what markets are included, how the luxury bands are defined, when the data is collected, and whether the result describes areas or individual properties. That context lets a reader decide whether the report fits the question at hand.
A parting thought
Use a dated report to ask a sharper question. Then check the current local evidence before turning a broad market signal into a client recommendation.
Request a complimentary one-hour conversation with a senior advisor who is an experienced operator. Talk through your next move.